Complete Pulse Characterization with the FROG Option available for pulseCheck Autocorrelators
pulseCheck and FROG Option
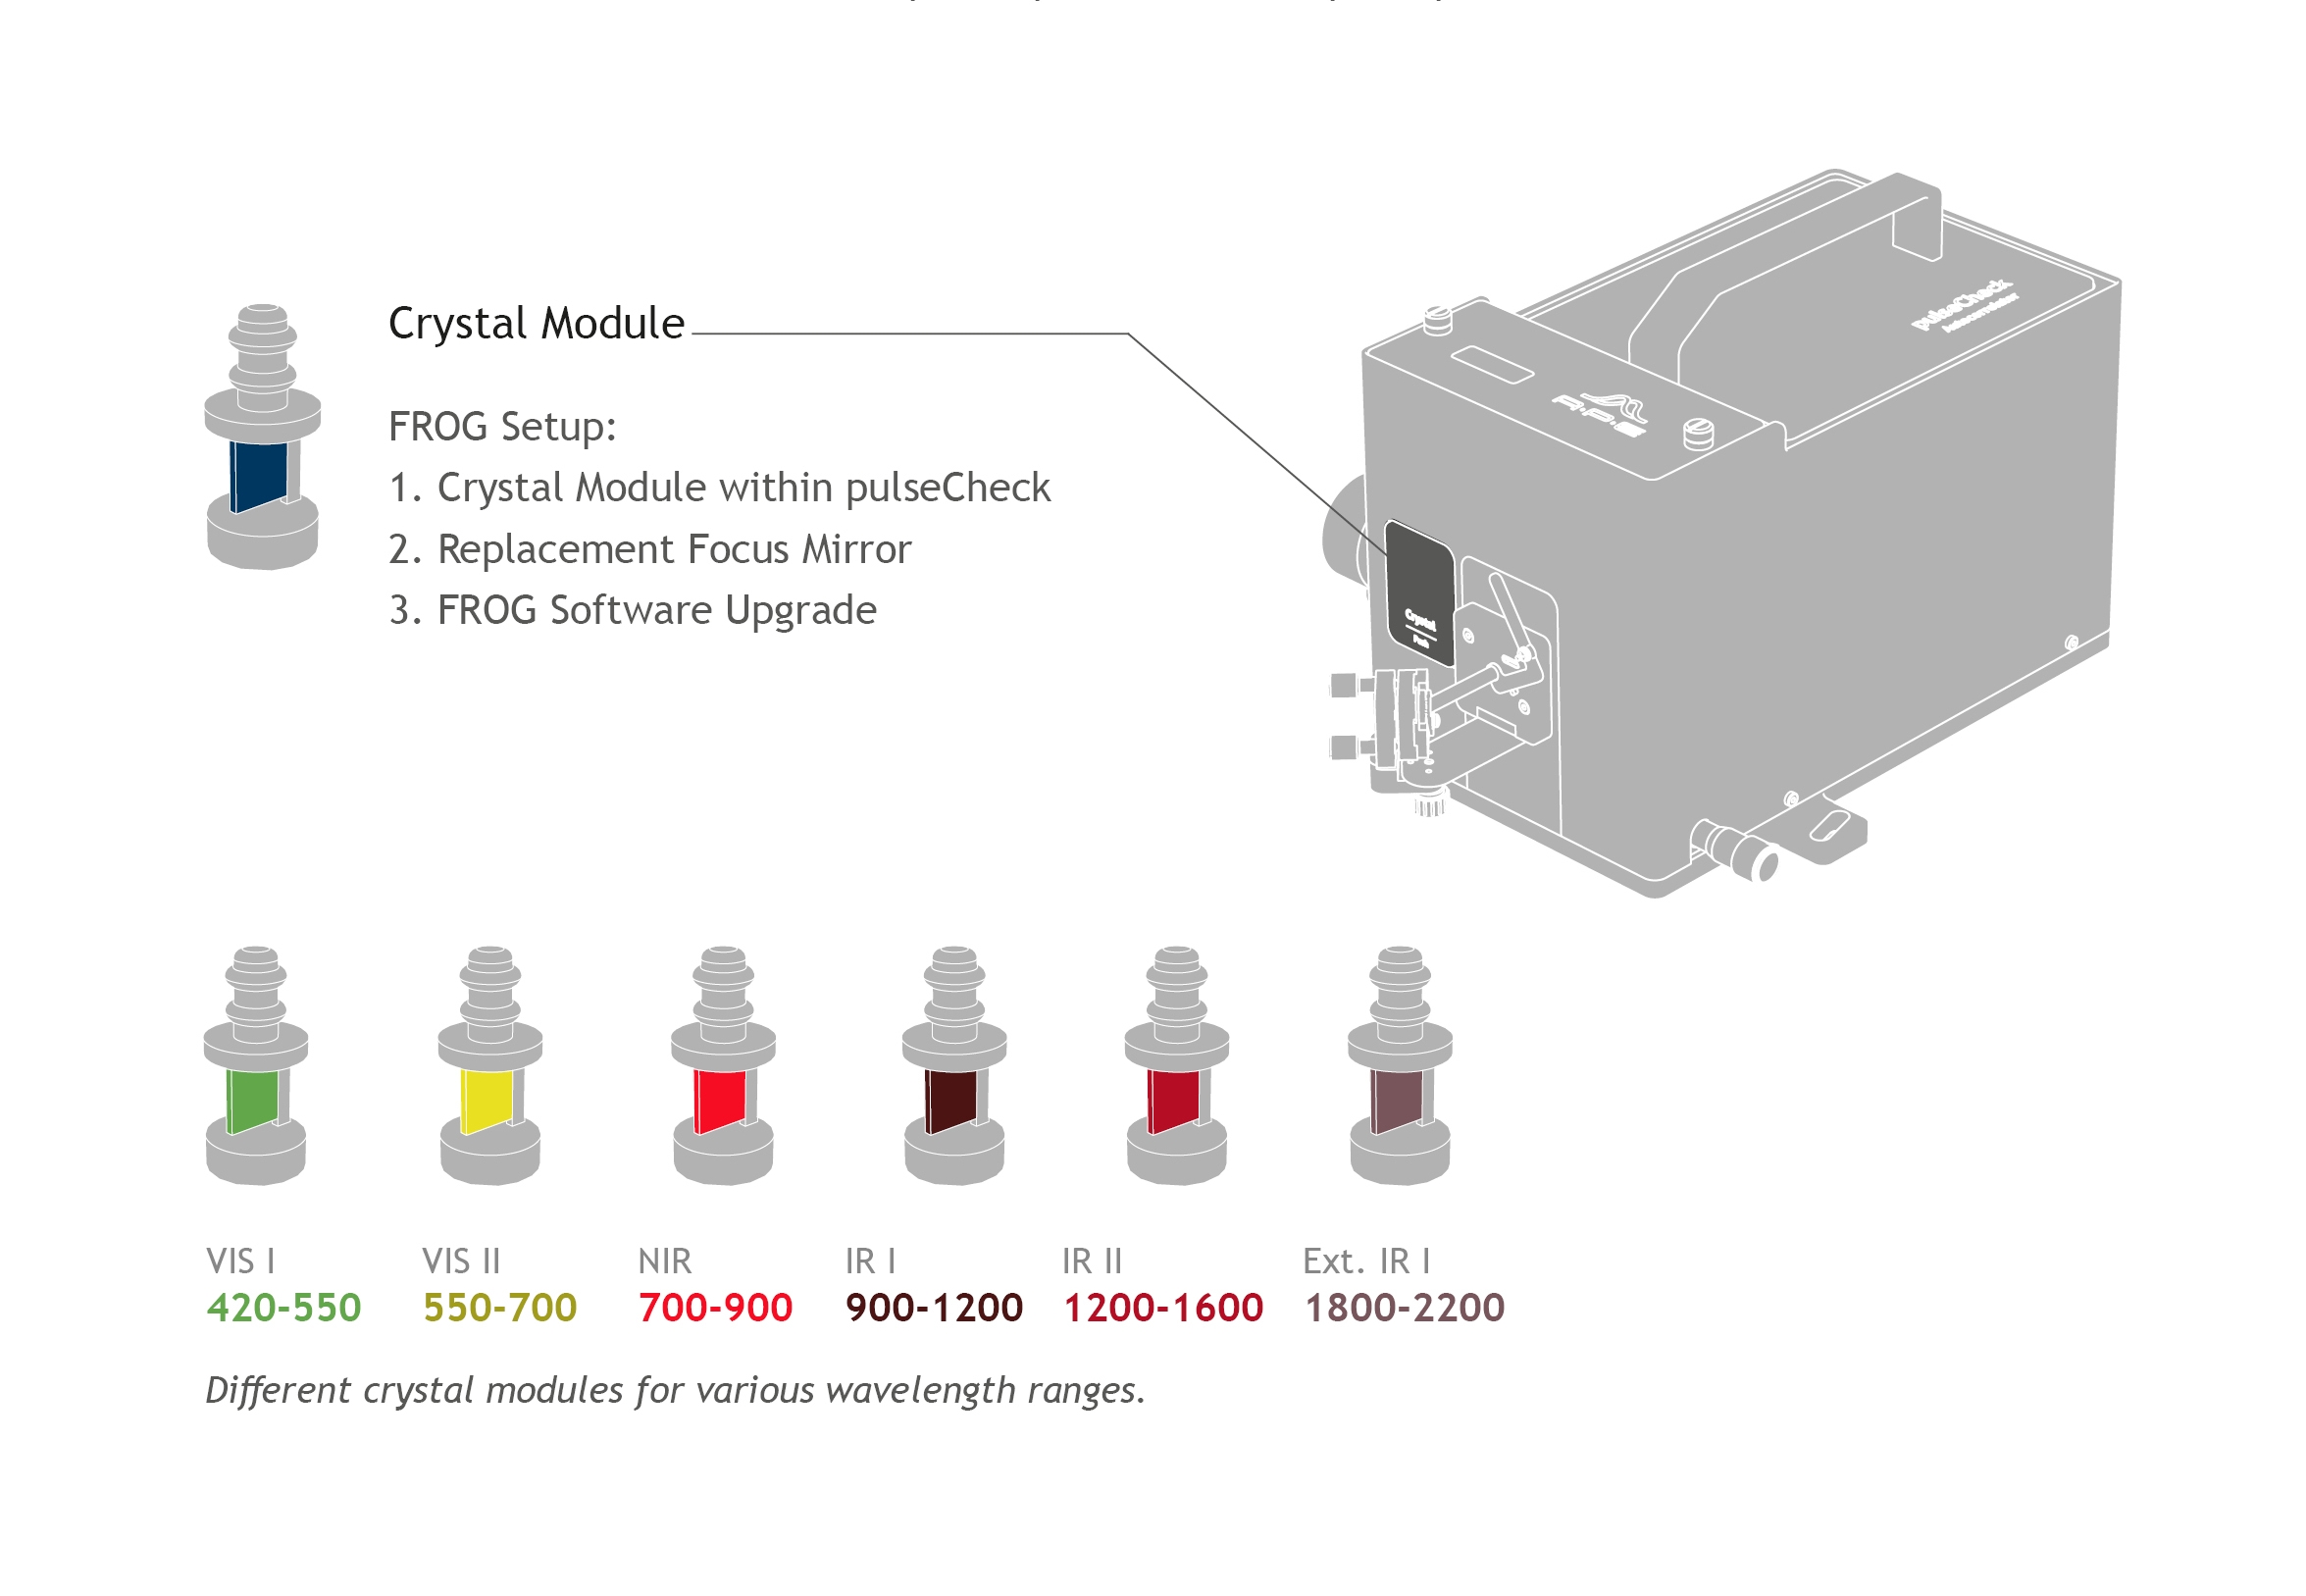
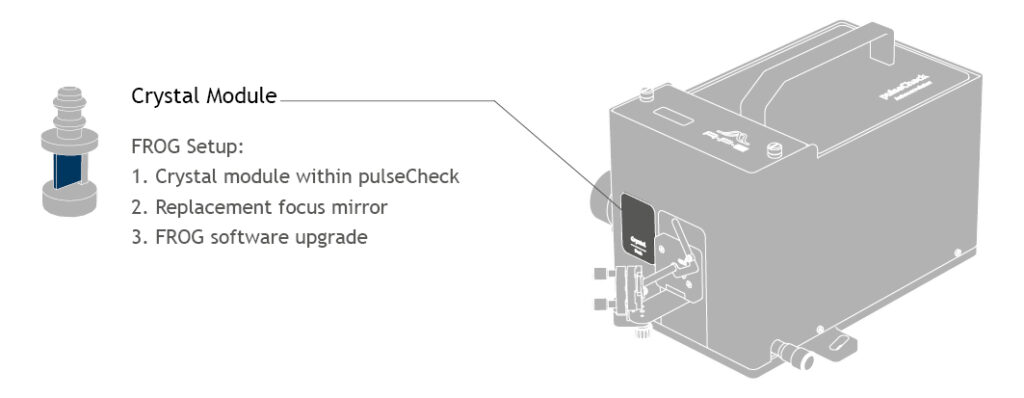
Second Harmonic Generation FROG is the most popular spectrometer-less frequency-resolved optical gate method. Most of APE’s pulseCheck autocorrelators optionally integrate FROG and enable complete pulse characterization. The addition of a dedicated nonlinear crystal module and special software opens the door to complete spectral and temporal pulse characterization. The FROG option allows the pulseCheck to measure the spectral and temporal bandwidth and phase with just a few adjustments to the autocorrelator.
The FROG Option consists of:
- FROG crystal(s)
- A plane FROG mirror
- FROG measurement and retrieval software
Wavelength and Pulse Duration Coverage
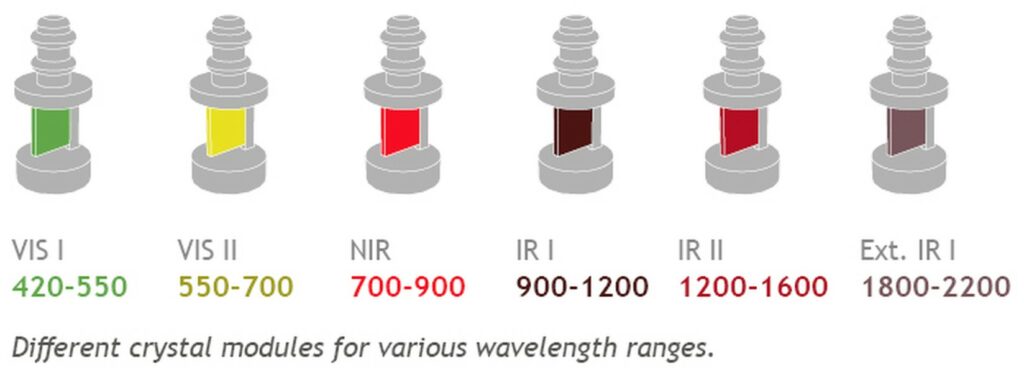
Various interchangeable crystals guarantee coverage of wavelengths between 420 nm and 2200 nm. Pulse widths from 20 fs to 6 ps and a spectral resolution of up to 0.1 nm are possible. For each crystal, the software includes calibration data that allows the crystal to be tuned to a specific wavelength for phase matching. The frequency-resolved optical gating option is designed for laser repetition rates above 10 kHz and is available for the pulseCheck autocorrelator series.
FROG Pulse Characterization Software
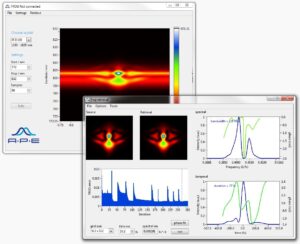
The acquisition and retrieval software provides the laser pulse intensity as a function of time and frequency (wavelength). This is visualized in the form of the common FROG trace diagram. With the implemented phase matching tuning routine of the pulseCheck it is only a matter of seconds to automatically find the desired phase matching angle of the FROG crystal.
Specifications
The FROG option is an addon available for pulseCheck autocorrelators. Please note that for FROG measurements a laser repetition rate of at least 10 kHz is required.
| FROG Crystals | Wavelength range | Pulse width range | Required spectral bandwidth | Spectral measurement resolution |
|---|---|---|---|---|
| A FROG crystal is suitable if the "Pulse width range" matches or, if the actual spectral bandwidth of the laser is wider than the "Required spectral bandwidth". | ||||
| VIS-I-200 | 420 nm … 550 nm | >200 fs | >1 nm | 0.1 nm |
| VIS-I-50 | 420 nm … 550 nm | 50 fs … 200 fs | >3 nm | 0.3 nm |
| VIS-I-20 | 420 nm … 550 nm | 20 fs … 70 fs | >10 nm | 1.0 nm |
| VIS-II-150 | 550 nm … 700 nm | >150 fs | >1 nm | 0.1 nm |
| VIS-II-50 | 550 nm … 700 nm | 50 fs … 200 fs | >3 nm | 0.3 nm |
| VIS-II-20 | 550 nm … 700 nm | 20 fs … 60 fs | >20 nm | 2.0 nm |
| NIR-200 | 700 nm … 900 nm | >200 fs | >1 nm | 0.1 nm |
| NIR-50 | 700 nm … 900 nm | 50 fs … 500 fs | >2 nm | 0.2 nm |
| NIR-20 | 700 nm … 900 nm | 20 fs … 50 fs | >30 nm | 3.0 nm |
| IR-I-150 | 900 nm … 1200 nm | >150 fs | >2 nm | 0.2 nm |
| IR-I-60 | 900 nm … 1200 nm | 60 fs … 200 fs | >10 nm | 1.0 nm |
| IR-I-30 | 900 nm … 1200 nm | 30 fs … 60 fs | >50 nm | 5.0 nm |
| IR-II-100 | 1200 nm … 1600 nm | >100 fs | >5 nm | 0.5 nm |
| IR-II-50 | 1200 nm … 1600 nm | 50 fs … 100 fs | >20 nm | 2.0 nm |
| IR-II-30 | 1200 nm … 1600 nm | 30 fs … 50 fs | >90 nm | 9.0 nm |
| Ext. IR-I-50 | 1800 nm … 2200 nm | >50 fs | >190 nm | 19 nm |
Datasheets & Brochures
APE FROG Rev. 4.1.2 (pdf / english)
APE pulseCheck NX+SM Rev. 4.3.1 (pdf / english)
or
Email & Phone Contacts
APE has distributors around the world to give you the best support. Choose a country to find your local sales contact:
Retrieving Spectral and Temporal Phase
With the software, a FROG trace can be retrieved iteratively directly after the trace has been recorded – or with a stored FROG trace. The raw measurement data are displayed in the “source frog trace” window of the software. The time and frequency axes are automatically scaled to meet the time to frequency ratio defined by the Fourier transformation. In addition, the software automatically optimizes all start parameters for the retrieval algorithm. Thus, in most cases no additional user input is required.
A comparison of Frequency-resolved Optical Gating (FROG) with Spectral Phase Interferometry for Direct Electric-field Reconstruction (Spider)
In comparison with other pulse characterization methods, FROG Frequency-resolved Optical Gating offers some differences. The following table gives some aspects that could be considered.
(SHG) FROG
- Optical setup similar to an Autocorrelator scheme
- Highly variable for different parameter ranges (pulse duration, wavelength)
- Direct sampling in the time domain possible
- Iterative fitting algorithm may make data interpretation more complex
- Measure spectrally broadband pulses in single shot mode often not possible
Spider
- Relatively complex setup
- Direct measurement in the spectral domain (amplitude and phase)
- Intrinsically single shot
- Insensitive to intensity noise
- Fast and direct reconstruction mathematics
- Unambiguous in the sign of the chirp and time
- Different parameter ranges often require an optimized single-setup

