Carpe
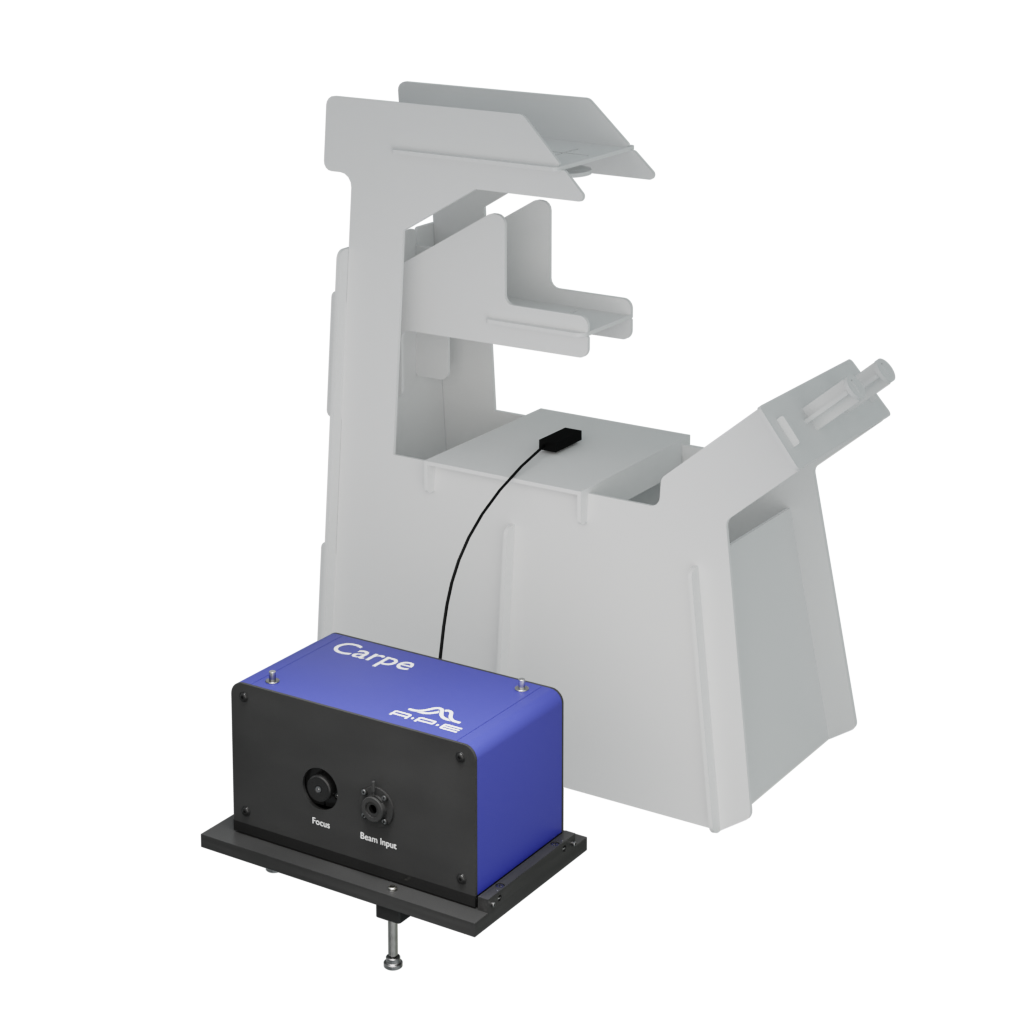
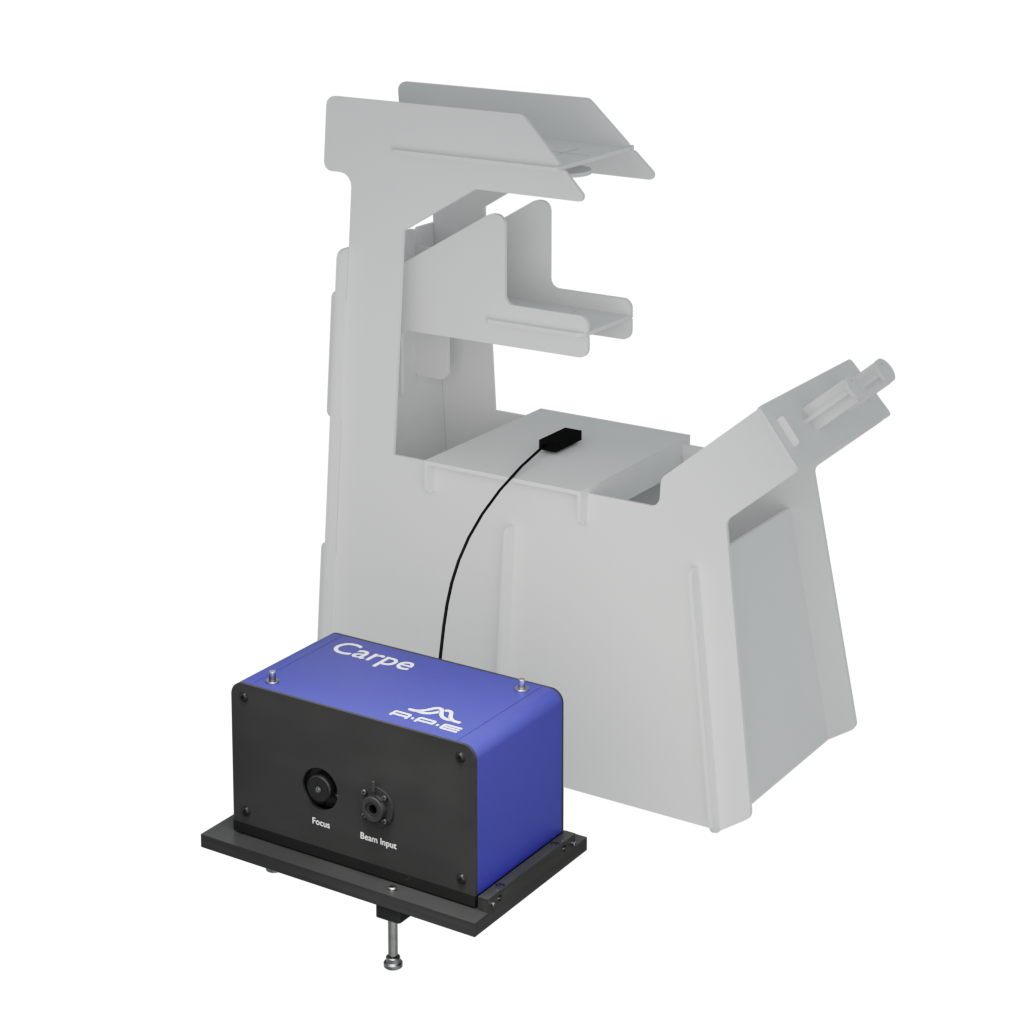
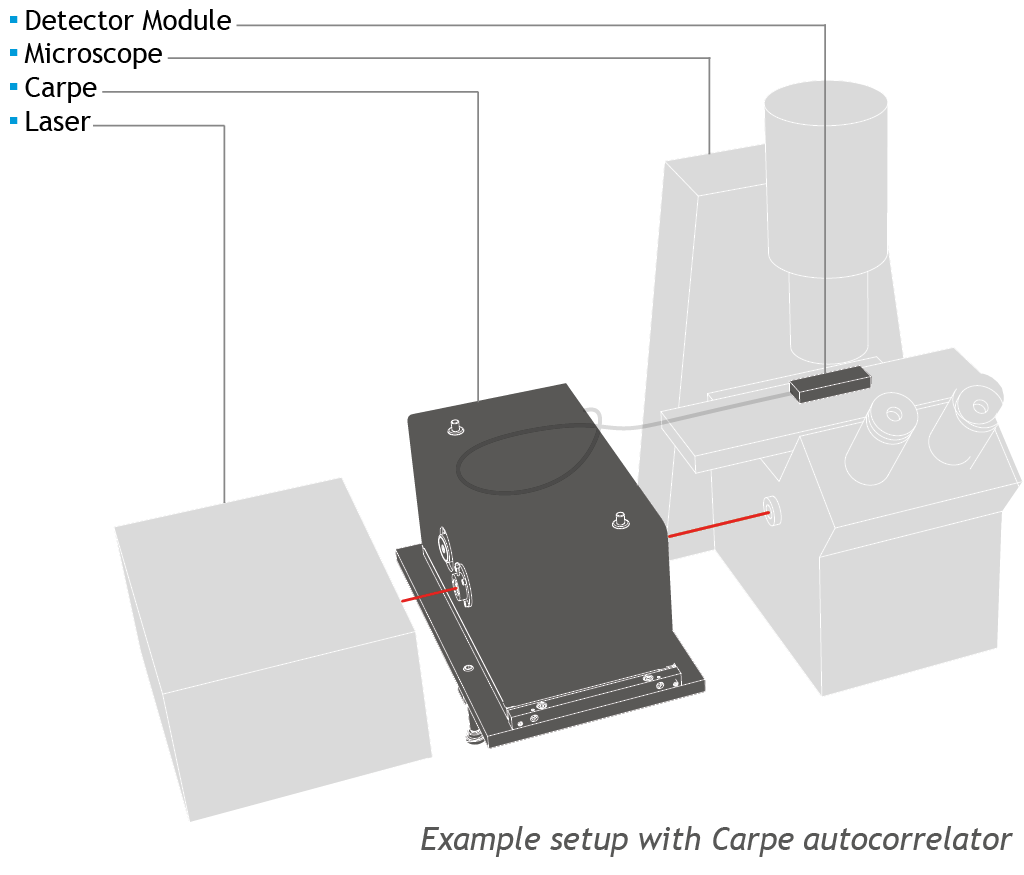
Carpe is a great way to check the duration of short laser pulses in an optical microscope system.
NIST Traceable Calibration
Laboratories and manufacturers are often faced with systematically establishing an unbroken chain of calibrations to specified references. All APE autocorrelator models are calibrated to a traceable standard in accordance with NIST (U.S. National Institute of Standards and Technology) measurement traceability specifications. A printed and signed calibration certificate is provided with each pulseCheck.
Master Pulse Broadening at the Microscope
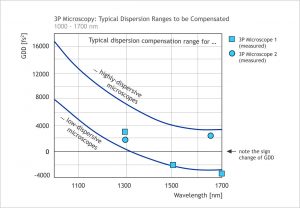
The Carpe autocorrelator measures the pulse duration at both the sample location and the input of the microscope. A comparison of the pulse widths obtained at these two spots enables you to calculate the pulse broadening effect. This effect is caused by dispersion of the microscope optics, but also depends to a large extent on the pulse width of the incoming laser beam.
Power Detection at the Sample Location
Power detection at the sample location supports systematic and quantitative studies which explore how laser power affects samples or the fluorescence lifetime of probes.
Optimize Microscopy Imaging
By examining the influence of the laser pulse duration, the power, and the dispersion of the microscope optics, you can fine-tune and optimize microscopy imaging at the relevant spot. These measurements can be also done using large NA (numerical aperture) or immersion lenses.
Specifications
At a Glance
| Carpe | VIS | NIR | IR |
|---|---|---|---|
| * Measured sensitivity including Optics Set, defined as average power times peak power of the incident pulses PAV * Ppeak | |||
| Pulse Width | 30 fs … 3.5 ps | ||
| Wavelength range | 420 nm … 700 nm | 700 nm … 1250 nm | 1250 nm … 2000 nm |
| Recommended repetition rate | >100 kHz | ||
| Sensitivity*, typical | 1 W2 | ||
| Max. input power, pulse energy | 0.5 W for quasi-cw laser 5 µJ for kHz laser |
||
| Input beam polarization | Linear, horizontal | ||
| Input beam coupling | Free-space with 6 mm aperture | ||
| Input beam height | 94 mm … 127 mm | ||
| Measurement refresh rate | 10 Hz | ||
| Delay resolution | 1 femtosecond | ||
| Type of measurement mode | Collinear intensity | ||
| Available detector types | Internal sensor: Two-Photon Absorption (TPA) External sensor: TPA exchangeable |
||
| External AC sensor | Measures pulse width at sample location, included for same wavelength range as internal detector, additional external sensors for other wavelength ranges are available and can be used with same base unit. | ||
| External power sensor, optional | Measures power at sample location wavelength range: 700 nm … 1050 nm, up to 300 mW |
||
| Working distance | >0.5 mm or <0.5 mm optional e.g. immersion lenses |
||
| Calibration | NIST traceable calibration certificate included | ||
| Intensity resolution | 16 bit | ||
| Connectivity | USB, TCP/IP (SCIP command set) | ||
| Remote control | Programmable via API | ||
- Study the effect of pulse duration, power, and optics dispersion on microscopy imaging
- Measure pulse widths at the sample position and point of microscope input
- Measure average power at sample position
- Estimate the peak power in conjunction with the pulse width
- Option: Short working distance, e.g. for immersion objective lenses
- Option: femtoControl for optimizing the duration of femtosecond laser pulses
Datasheets & Brochures
APE Carpe Rev. 4.2.1 (pdf / english)
APE Carpe Step-file(0824) (packed .stp file)
Step File
![]() Carpe_Stepfile_20130214 (.stp 3D CAD model with overall dimensions)
Carpe_Stepfile_20130214 (.stp 3D CAD model with overall dimensions)
or
Email & Phone Contacts
APE has distributors around the world to give you the best support. Choose a country to find your local sales contact:
Better Imaging with Dispersion Control
Application Example
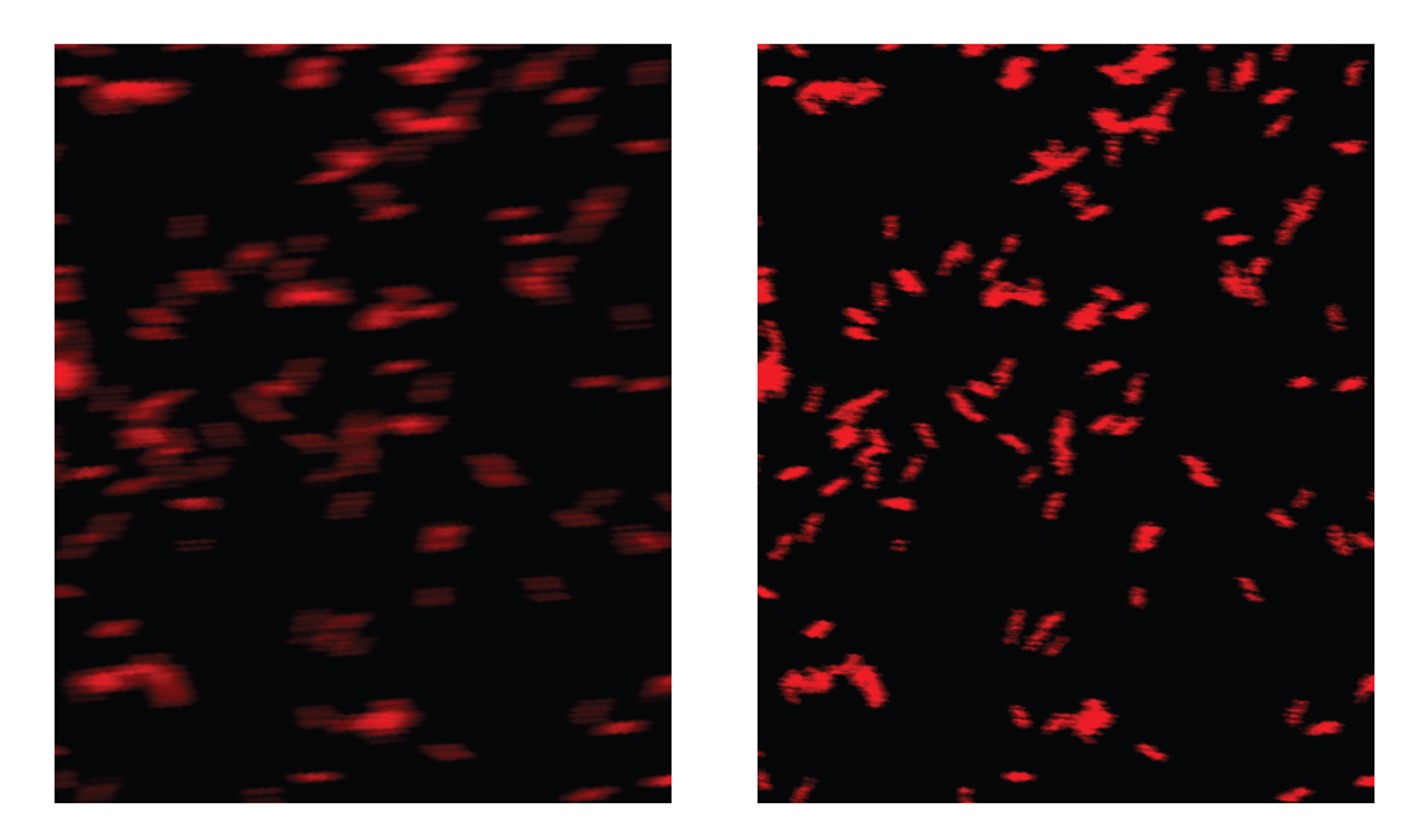
Carpe in combination with femtoControl can help to achieve more crisp and clearer microscope images. The increased information content of the images is due to a solution that detects and corrects inevitable dispersion effects when using femtosecond laser pulses for multi-photon microscopy.
The laser pulse duration is measured at both the input of the microscope and at the sample location under the microscope. This allows to detect dispersion effects and to compensate them with femtoControl.
Furthermore, power detection at the sample location supports systematic and quantitative studies, which can help exploring how the laser power affects the received signals and images.

